Multi-location paid search · Dublin
Your best location is covering for your worst. Paid search shouldn't hide that.
Growvora runs Google Ads for brands with 5 to 80 locations: dental groups, gyms, garden centres, franchises. Every branch gets its own budget, its own conversion data, and its own line in the monthly report. Averages are where underperformers go to nap.

3.4
median blended ROAS, managed brands
41
locations managed
11
brands on the roster
2.7×
median best-to-worst branch CPL spread
Aggregates from live client estates, restated quarterly.
The branch ledger
Six lines from last month's client ledgers, anonymized. This is the whole method in one table: when every branch has its own line, the flagged ones get budgets moved and landing pages fixed instead of a comfortable average.
| Client | Branch | Spend, 30d | Result | Status |
|---|---|---|---|---|
| Dental group | Cork | €2,380 | €31 / booking | ▲ improving |
| Dental group | Galway | €1,140 | €58 / booking | ▼ flagged, landing page |
| Gym chain | Tallaght | €880 | €18 / trial | ▲ improving |
| Gym chain | Naas | €910 | €43 / trial | ▼ flagged, budget moved |
| Garden centres | Kilkenny | €1,540 | ROAS 3.2 | ▲ improving |
| Garden centres | Drogheda | €1,470 | ROAS 1.9 | → watching, seasonal |

Engagements, told week by week
All engagementsDental group · 12 locations · 14 weeks
ROAS 2.6 → 4.2
Six branches carried twelve. The diary shows the week the account stopped pretending otherwise.
Garden centres · 9 stores · 90 days
ROAS 1.7 → 2.9
Click-and-collect finally measured, then fed.
Gym chain · 23 sites · 8 weeks
CPL €38 → €19
Trial cost halved.
“The origin story is a nine-branch dental group whose Cork location quietly ate 60% of the budget. Nobody was lying. The average just never asked.”
What we run
Google Ads management
Per-location campaign architecture, weekly query reviews, and reporting that names branches instead of blending them.
Details →Local Services Ads
Pay-per-lead LSAs with Google Verified onboarding. Home-services leads average about $53; we manage disputes and rankings.
Details →Call & lead tracking
Calls counted as conversions, GA4 wired per location, offline imports closing the loop from lead to booked revenue.
Details →Geo expansion
Per-location budget tests and geo experiments, so a new branch launches with evidence instead of a hunch.
Details →How an engagement runs
Free audit
Per-location table, three biggest gaps, four working days
Rebuild
Per-branch campaigns, budgets, and tracking wired in month one
Weekly routine
Query reviews, budget pacing, one experiment at a time
Branch ledger
Monthly report: one line per location, no blending
Who this is built for

Dental & clinic groups
Bookings per chair, per practice. Dentists convert search at a 10.67% median; a group below it has a findable reason.
Fitness chains
Trial memberships per site against the $67.36 vertical CPL median, with join-rate follow-through.
Home & garden retail
Click-and-collect measured per store; the vertical's $8.33 median CPC punishes waste fast.
Franchise services
Per-territory budgets and LSA coverage, so franchisees see their own numbers, not the network's.
Click-and-collect ecommerce
Store visits and online orders in one per-location view, measured against the ecommerce field's 2.87 average return.
Free tool · no email wall
The branch budget splitter
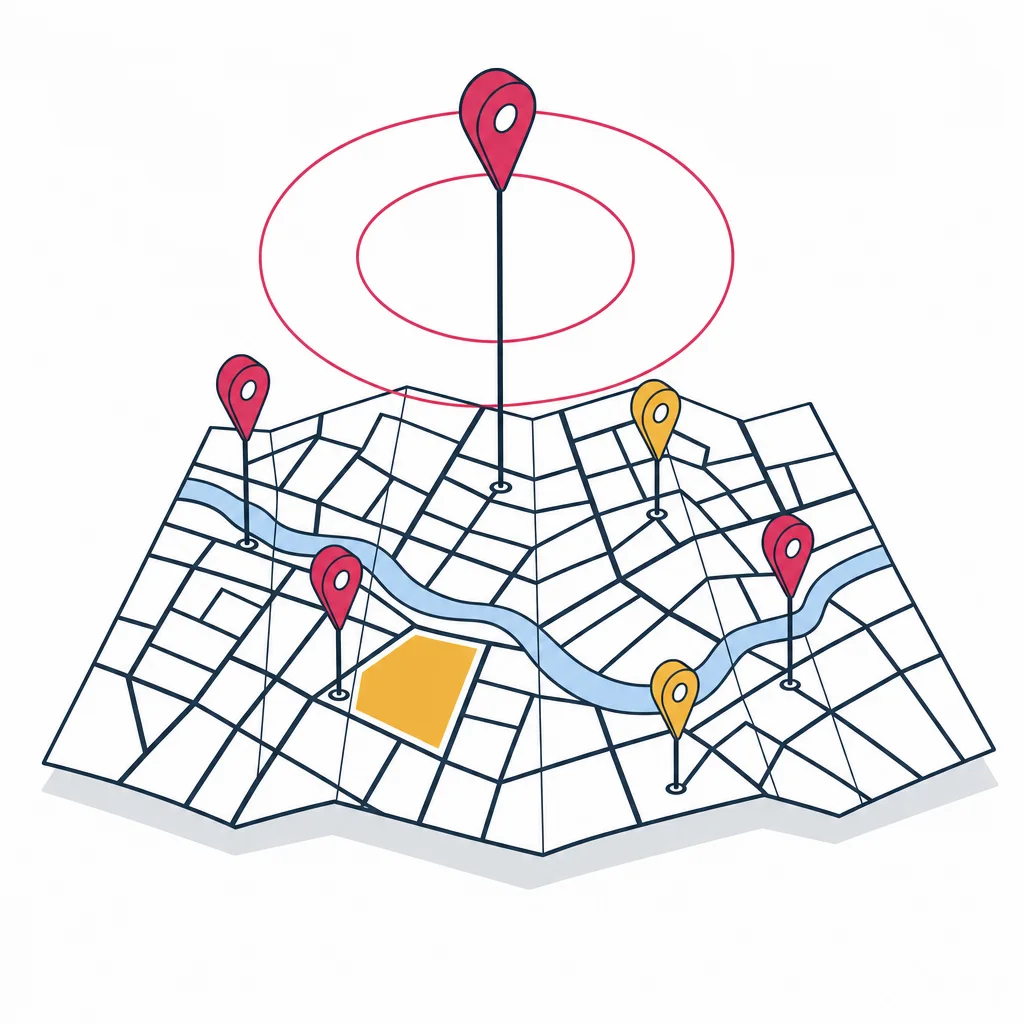
Enter your locations and monthly budget, get a defensible per-branch split with a testing reserve and a per-location floor, in a table you can paste straight into the budget meeting. It runs on this site, ungated, because tools behind email walls are just brochures with homework.
Open the splitter- Google Ads Certified
- Local Services Ads: Google Verified onboarding
- GA4 + offline conversion imports
Fair questions
What does the free audit actually include?
A per-location read of your account: spend, cost per lead, and conversion rate split by branch, benchmarked against your vertical's 2026 medians. You get the location table, the three biggest gaps, and what we would run first. It takes us about four working days and costs nothing.
Why per-location instead of one account view?
Because blended averages hide failures. Across our audits, the median gap between a brand's best and worst branch is a 2.7 times difference in cost per lead. One number for the whole account cannot show that; a per-location ledger makes the underperformers impossible to ignore.
What does Growvora cost?
Management from €1,250 a month or 11% of ad spend, whichever lands higher, plus €95 a month per location beyond your first five, which funds the per-branch reporting. No setup fee. Against the market's usual 10-20% of spend, 11% with location-level reporting sits at the sharp end.
Do you work with single-location businesses?
Rarely. The whole practice is built around comparing branches: per-location budgets, geo experiments, a report with one line per site. With one location there is nothing to compare, and a generalist agency will serve you just as well, usually cheaper. From five locations up, the method starts paying.
See your branches side by side
The free audit returns a per-location table in four working days. Some brands frame it. Some brands wince. Either way, you finally know.
Request your free audit